The University of Oregon Police Department collects and freely shares data about its operations.
Enforcement data 2019
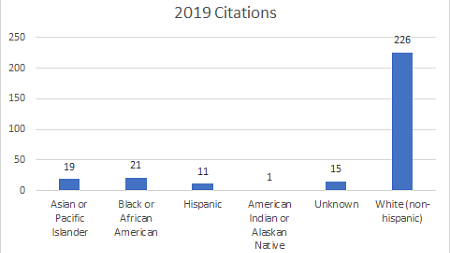
CITATIONS ISSUED
- White (non-Hispanic): 226 (77%)
- Black or African American: 21 (7%)
- Asian or Pacific Islander: 19 (6%)
- Hispanic: 11 (4%)
- American Indian or Alaska Native: 1 (<1%)
- Unknown: 15 (5%)
ARRESTS
- White (non-Hispanic): 309 (86%)
- Black or African American: 29 (8%)
- Asian or Pacific Islander: 14 (4%)
- Hispanic: 5 (2%)
- American Indian or Alaska Native: 1 (<1%)
- Unknown: 1 (<1%)
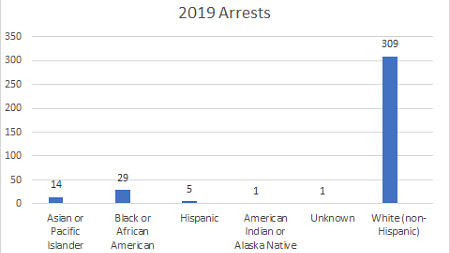
Note: This data was revised and corrected on Sept. 2, 2020, because of a technical error.
ACTIVE LETTERS OF TRESPASS
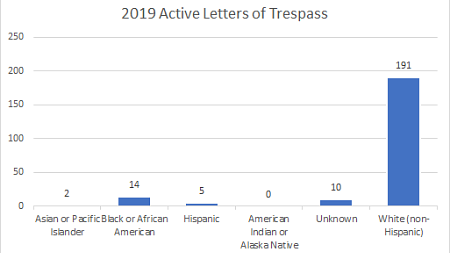
- White (non-Hispanic): 191 (86%)
- Black or African American: 14 (6%)
- Asian or Pacific Islander: 2 (1%)
- Hispanic: 5 (2%)
- American Indian or Alaska Native: 0
- Unknown: 10 (5%)
Use of force 2019
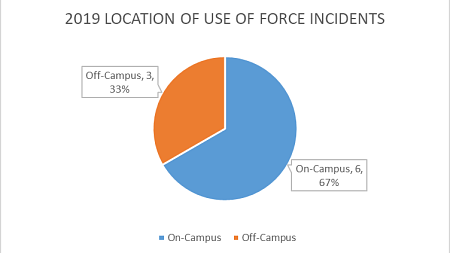
In 2019, UOPD had 12,928 calls for service (6,429 officer-initiated, 5,607 reactive and 892 traffic stops). Of those, nine included use of force, or 0.07 percent.
TYPES OF FORCE
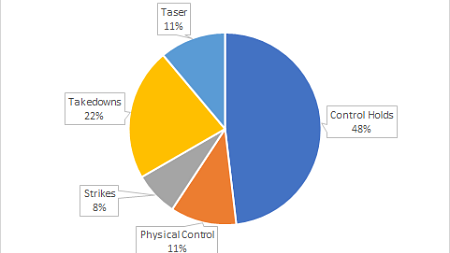
The breakdown below details the types of force used in the nine total incidents of use of force in 2019. Note: some incidents involved the use of several types of force.
Control Holds - 13
Physical Control (Pain Compliance/Pressure Points) - 3
Strikes - 2
Takedowns - 6
Taser - 3
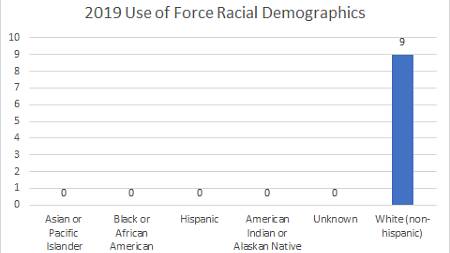
USE OF FORCE RACIAL DEMOGRAPHICS
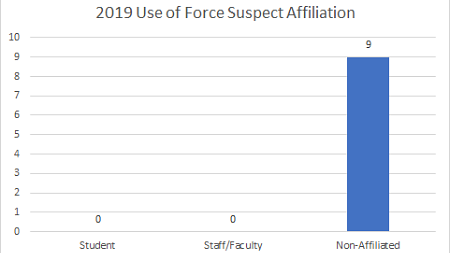
USE OF FORCE SUBJECT AFFILIATION
LOCATIONS
